Sector analysis / Timber and wood processing
Forest and timber: a resource to process at home
Forest covers 91% of the territory and its loss remains limited. Since the 2010 log export ban, the industry has reorganised around local processing, with modest rents and growing market requirements.
Context
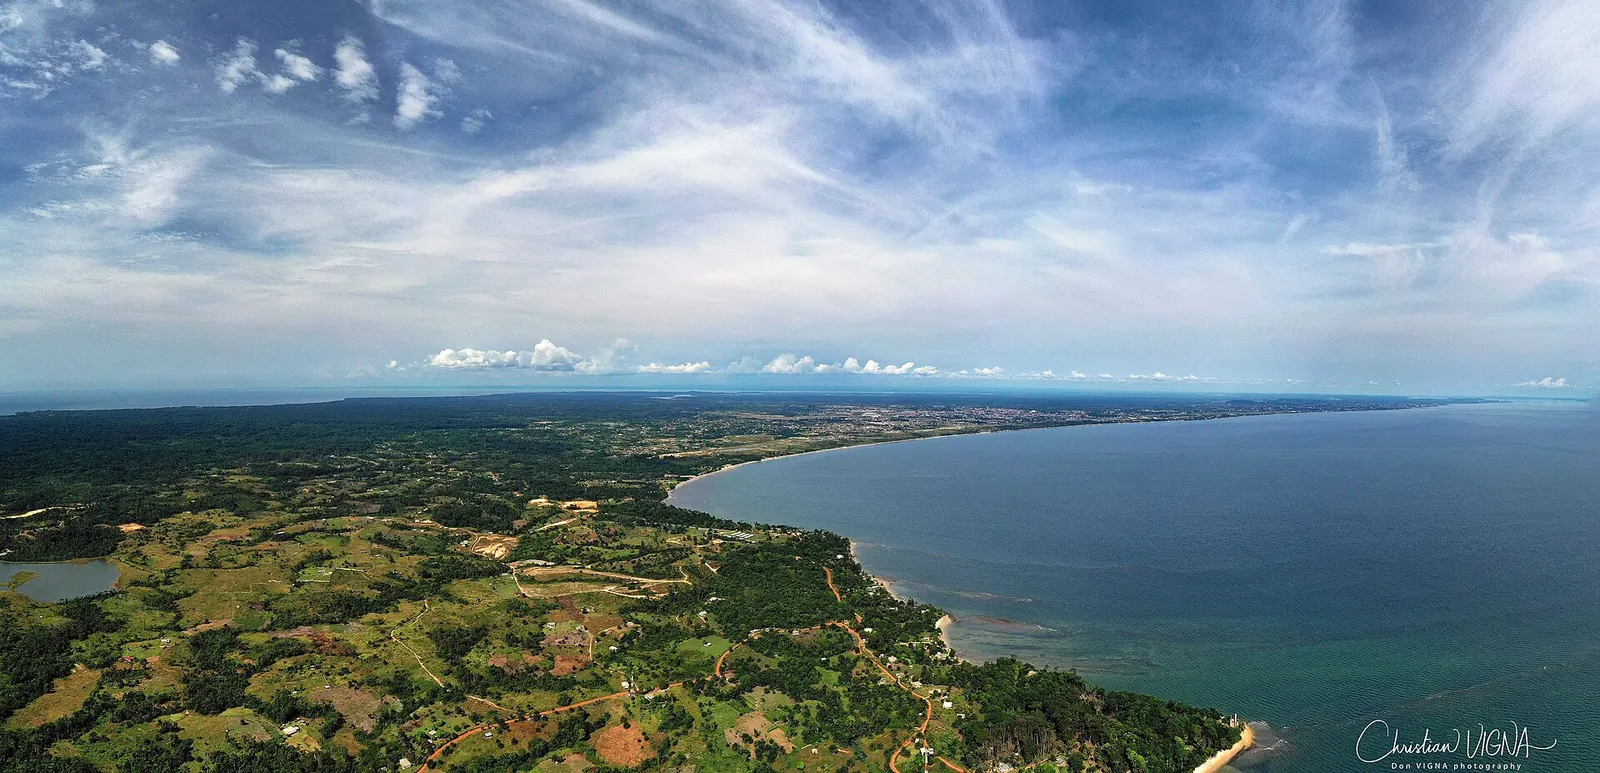
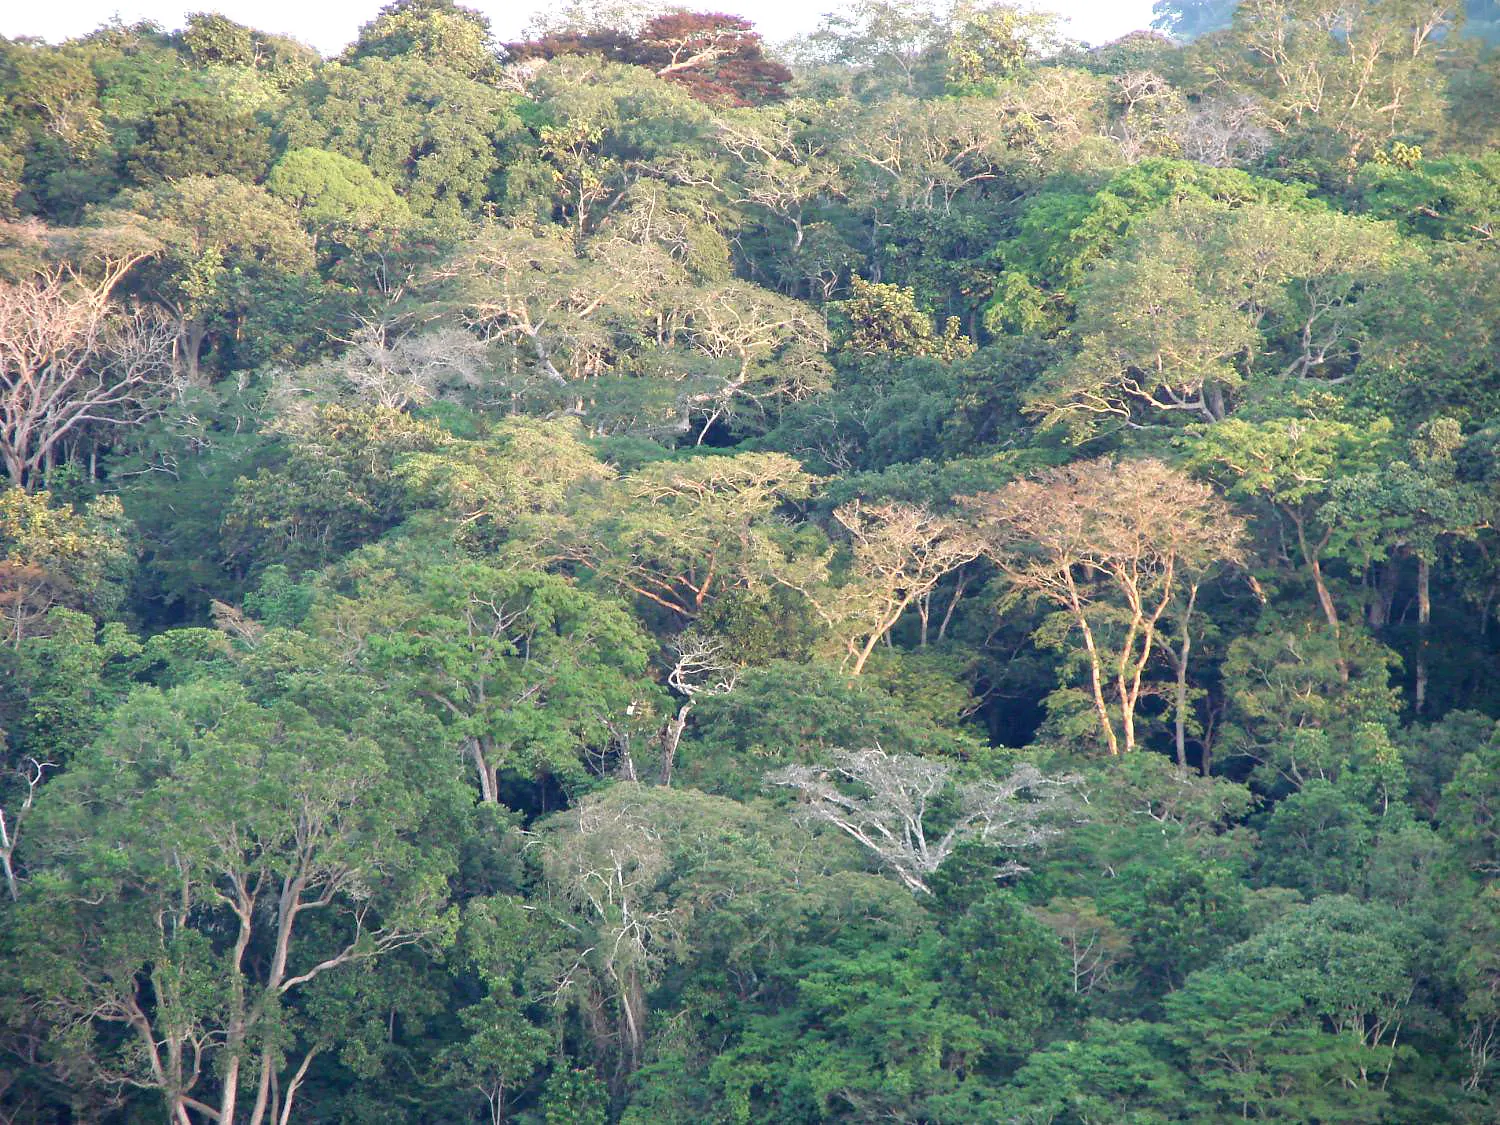
Forest covers more than 90% of Gabon's territory. It supplies the timber harvested by the forest industry and also matters for biodiversity and carbon storage. Forest policy rests on Law no. 016/01 of 31 December 2001 on the forest code, which organises forest management, harvesting titles and community participation.
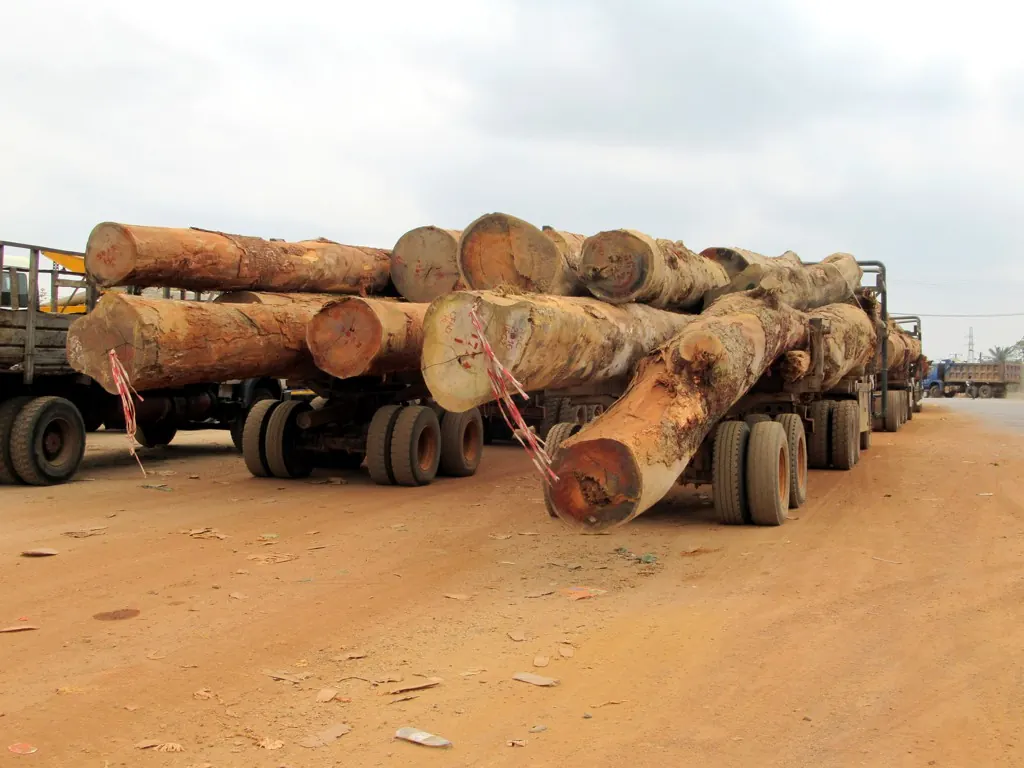
The industry's major turning point came in 2010. Decided in the Council of Ministers on 5 November 2009, the ban on exporting logs, meaning unprocessed trunks, took effect on 15 May 2010. Since then, all harvested wood must be processed in Gabon before export.
Reference texts
-
Forest code
Loi n° 016/01 du 31 décembre 2001 portant code forestier en République gabonaise
Key figures
According to the World Bank, which draws on the forest resources assessments of the Food and Agriculture Organization of the United Nations (FAO), forest covered 234,950 km² in 2023, or 91.2% of land area. Forest concessions under sustainable management (CFAD) covered about 13.3 million hectares in 2020 according to the Timber Trade Portal, a little over half of the forest area. A further 1.5 million hectares or so were under provisional management, harvesting and processing agreements (CPAET) in early 2020.
Forest and timber
Forest area (% of land area)
91.2 %
2023
Source: World Bank
Forest area
234,950 km²
2023
Source: World Bank
Forest rents
2.6 % of GDP
2021
Source: World Bank
3.9 %
2023
Source: World Bank
Industry framework
Concessions under sustainable management (CFAD)
13.3 million hectares
2020
Maximum size of a community forest
5,000 hectares
2020
Trends
Stable forest cover, with loss accelerating slightly
Forest area went from 237,616 km² in 1990 to 237,000 km² in 2000, 236,494 km² in 2010, 235,306 km² in 2020 and 234,950 km² in 2023. The cumulative loss, about 2,670 km² over 33 years, is a little over 1% of the 1990 forest. The implied annual pace has changed, however: about 62 km² a year in the 1990s, 51 km² in the 2000s, then 119 km² a year between 2010 and 2020. These series are interpolated between FAO assessment years and should be read as trends rather than annual measurements.
Modest and variable forest rents
Forest rents as calculated by the World Bank, meaning the value of harvested wood minus costs, stood between 3.7% and 4.7% of GDP between 1995 and 2003. They fell to 2.0% in 2010 and 1.5% in 2011, when the log export ban came into force, then rose back to between 2% and 3.3% of GDP from 2012 (2.65% in 2021, the latest year available).
Forest cover
Forest area, % of land area
Forest area (% of land area) (Gabon) went from 92.2% in 1990 to 91.2% in 2023.
| Period | Forest area (% of land area) (%) |
|---|---|
| 1990 | 92.2 |
| 1991 | 92.2 |
| 1992 | 92.2 |
| 1993 | 92.1 |
| 1994 | 92.1 |
| 1995 | 92.1 |
| 1996 | 92.1 |
| 1997 | 92.0 |
| 1998 | 92.0 |
| 1999 | 92.0 |
| 2000 | 92.0 |
| 2001 | 92.0 |
| 2002 | 91.9 |
| 2003 | 91.9 |
| 2004 | 91.9 |
| 2005 | 91.9 |
| 2006 | 91.9 |
| 2007 | 91.8 |
| 2008 | 91.8 |
| 2009 | 91.8 |
| 2010 | 91.8 |
| 2011 | 91.7 |
| 2012 | 91.7 |
| 2013 | 91.6 |
| 2014 | 91.6 |
| 2015 | 91.6 |
| 2016 | 91.5 |
| 2017 | 91.5 |
| 2018 | 91.4 |
| 2019 | 91.4 |
| 2020 | 91.3 |
| 2021 | 91.3 |
| 2022 | 91.2 |
| 2023 | 91.2 |
Exports: local processing changes the classification
The share of agricultural raw materials in merchandise exports, which includes logs and sawn wood among other items, was 11.8% in 2000. It fell to 3.6% in 2010 and 1.6% in 2013, before rising to between 4.8% and 6.5% from 2017 to 2021, then returning to 3.9% in 2023. This indicator does not capture all of the industry's activity: more processed wood products such as veneer and plywood are counted by the international trade classification as manufactured goods rather than raw materials. With the obligation to process wood locally, it therefore reflects only part of the sector's exports.
Constraints
- Logistics and demand. The World Bank April 2026 Macro Poverty Outlook reports that transport, labour and demand problems weighed on the timber industry in 2025.
- Market requirements. The EU deforestation regulation places a due diligence obligation on operators who put timber on the European Union market. The Timber Trade Portal notes that FSC (Forest Stewardship Council) forest management certification provides additional verification but does not replace this obligation.
- Taxation. The World Bank lists higher wood export duties among the measures planned to support tax revenue.
Outlook
The World Bank projects average growth of 3.3% a year over 2026 to 2028 and cites global demand for timber among the drivers that would offset the structural decline of oil. For the industry, the issues are moving local processing up the value chain, meeting export markets' traceability requirements and keeping forest cover above 90% of the territory. Gabon Eco series on forest cover, rents and exports make it possible to track these developments over time.