Infrastructure
Ports, stations, airports and corridors
The country’s main transport and energy infrastructure, on sourced maps.

Official and international figures, key sectors, applicable legislation and the steps to import, export or set up a company, brought together in one place with their sources.
3.4%
Real GDP growth, 2024, Source: International Monetary Fund
2.59million
Total population, 2025, Source: World Bank
8,263USD
GDP per capita, 2025, Source: World Bank
Gabon in figures
Total population
Source: General Directorate of Statistics of Gabon, 2013
The map cannot be displayed in this browser. The list of places remains available.
Real GDP growth
3.4%
+0.9 pts compared with 2023
Crude oil production
227.0kbbl/d
+2.3% compared with 2024
Manganese ore production
7,103kt
+4.4% compared with 2024
Veneer and sawn wood exports
1,6461000 m³
+42.7% compared with 2020
GDP per capita
8,263USD
+0.4% compared with 2024
Inflation (consumer prices)
1.2%
−2.5 pts compared with 2023
In 2025, Gabon’s exports of goods and services were equivalent to 55.5% of gross domestic product (GDP), and imports to 29.4%.
Source: World Bank, 2025
Gross public debt
70.9% of GDP
+0.3 pts compared with 2023
Foreign direct investment, net inflows
1,145M USD
−0.5% compared with 2023
Total population
2.59million
+2.1% compared with 2024
Access to electricity
95.1%
+1.0 pts compared with 2023
Internet users
68.7%
+0.5 pts compared with 2023
3.4% real growth in 2024
Real gross domestic product (GDP) grew by 3.4% in 2024, after 2.4% in 2023. The International Monetary Fund (IMF) estimates growth at 2.5% in 2025.
Annual change in %, 2025 and 2026: IMF estimates
Real GDP growth (Gabon) went from −1.9% in 2000 to 2.7% in 2026. The highest value was reached in 2010 (7.4%).
| Period | Real GDP growth (%) |
|---|---|
| 2000 | −1.9 |
| 2001 | 2.1 |
| 2002 | −0.2 |
| 2003 | 2.2 |
| 2004 | 0.7 |
| 2005 | 3.9 |
| 2006 | −3.6 |
| 2007 | 6.5 |
| 2008 | −3.0 |
| 2009 | −1.2 |
| 2010 | 7.4 |
| 2011 | 7.1 |
| 2012 | 5.3 |
| 2013 | 5.5 |
| 2014 | 4.4 |
| 2015 | 3.9 |
| 2016 | 2.1 |
| 2017 | 0.5 |
| 2018 | 0.9 |
| 2019 | 3.8 |
| 2020 | −1.8 |
| 2021 | 1.5 |
| 2022 | 3.0 |
| 2023 | 2.4 |
| 2024 | 3.4 |
| 2025 | 2.5 e |
| 2026 | 2.7 e |
p: provisional; e: estimate.
Provisional or estimated values are drawn with dashed lines.
Infrastructure
The country’s main transport and energy infrastructure, on sourced maps.
Real economy
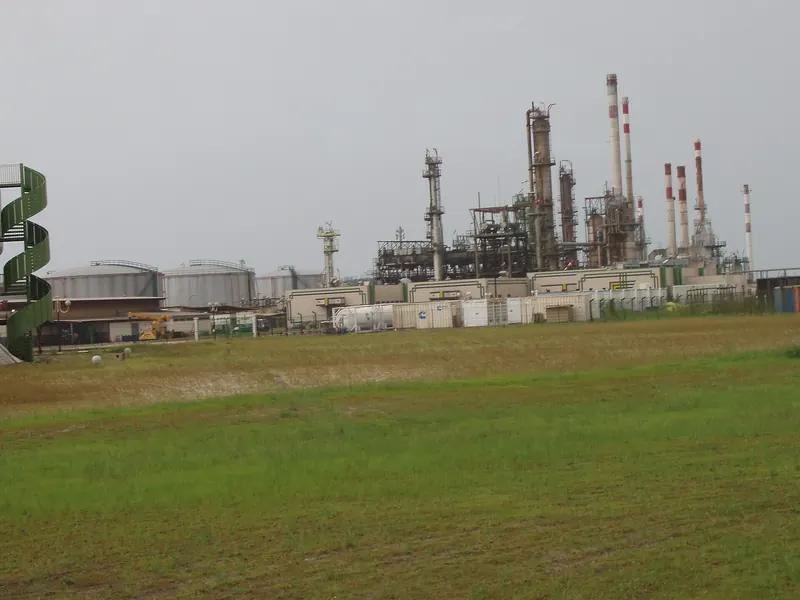
Crude oil production, exports and revenues.
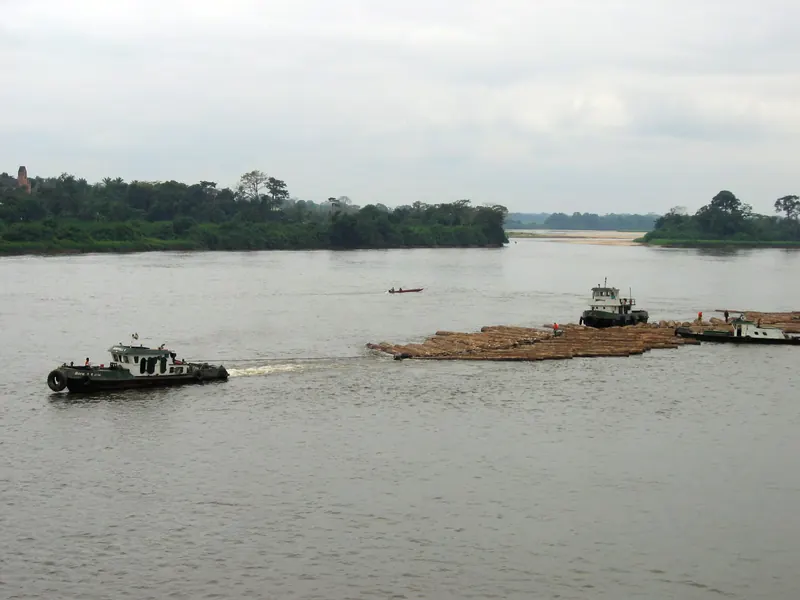
Logging, sawn wood, veneer and plywood.
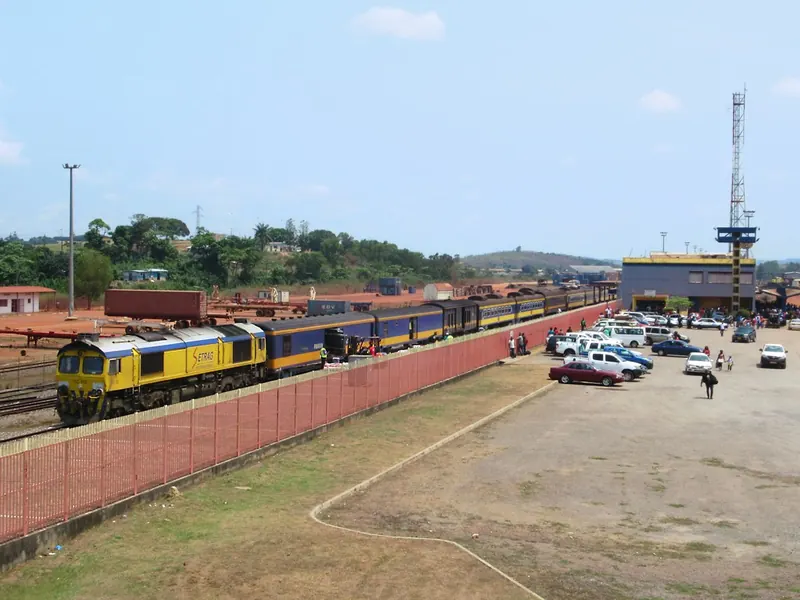
Road and rail routes, ports and border posts linking Gabon with its neighbours.
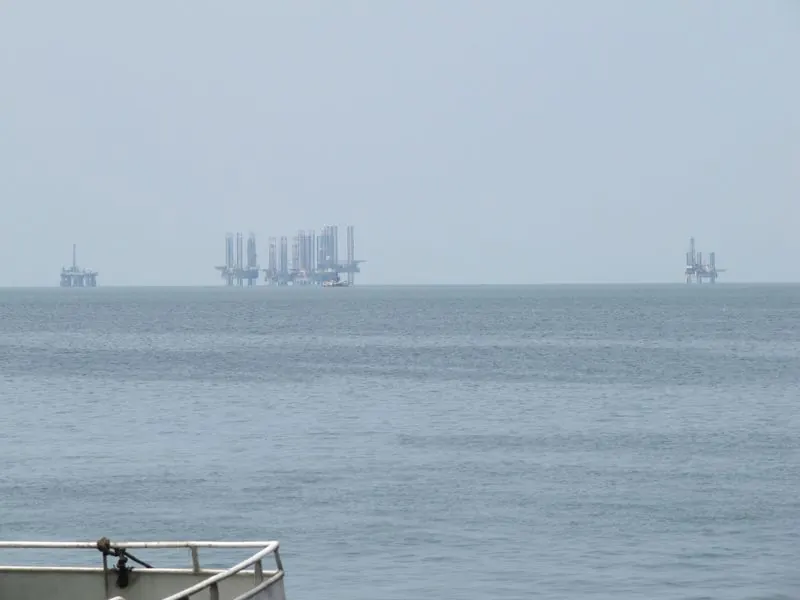
Natural gas production and use.
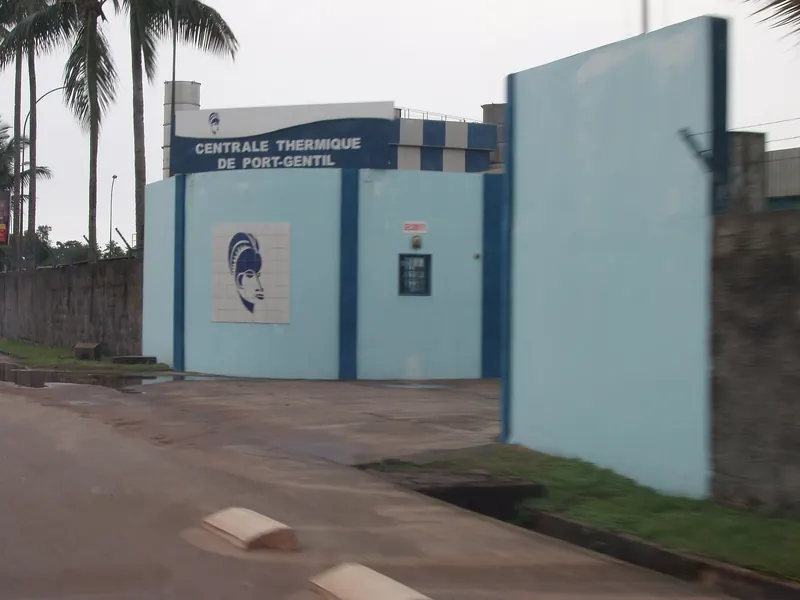
Electricity and water generation and distribution.
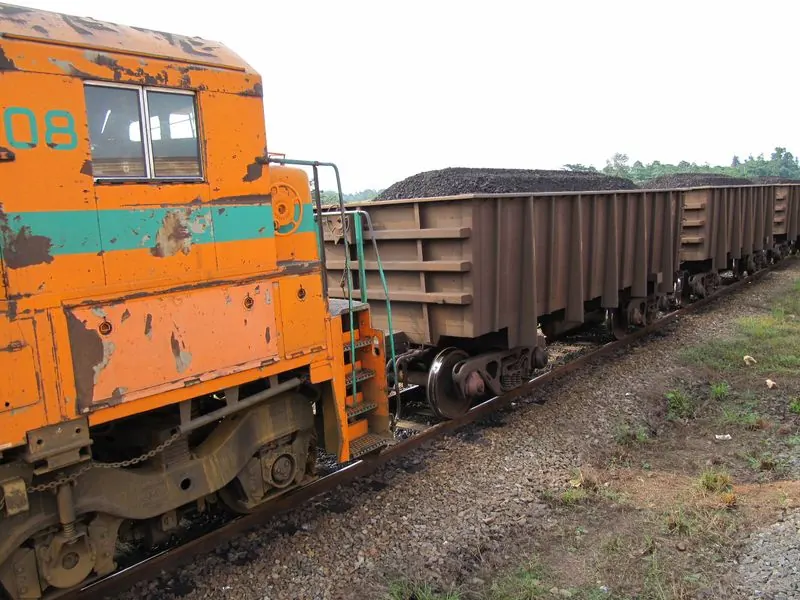
Manganese, gold, iron ore and other mineral resources.
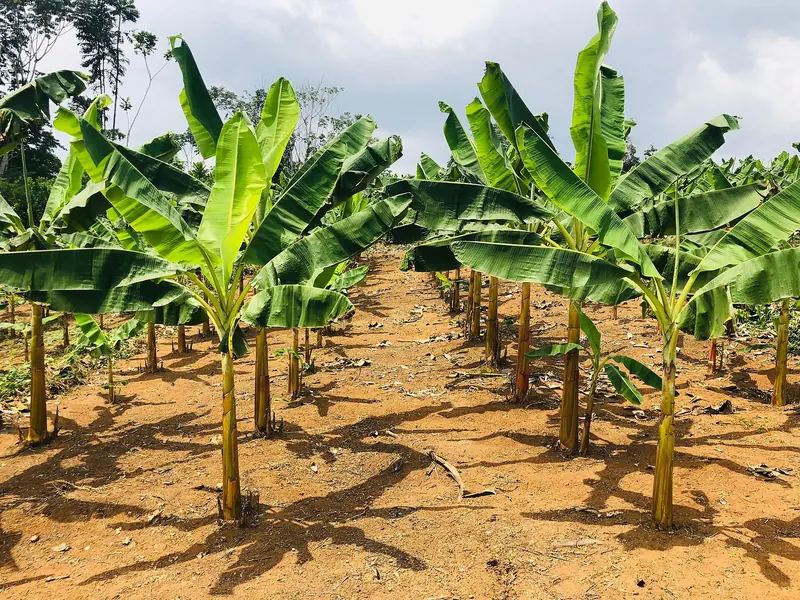
Palm oil, rubber, sugar and food processing.
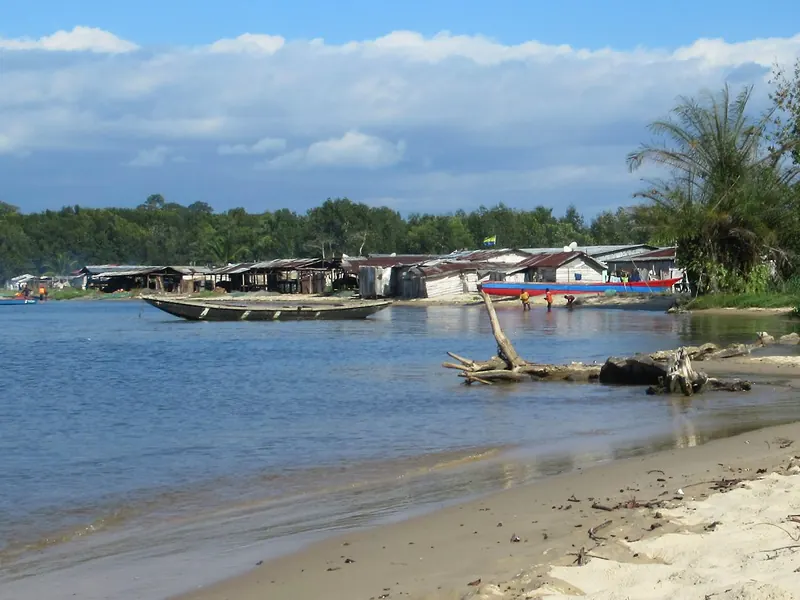
Food crops, livestock, artisanal and industrial fisheries.
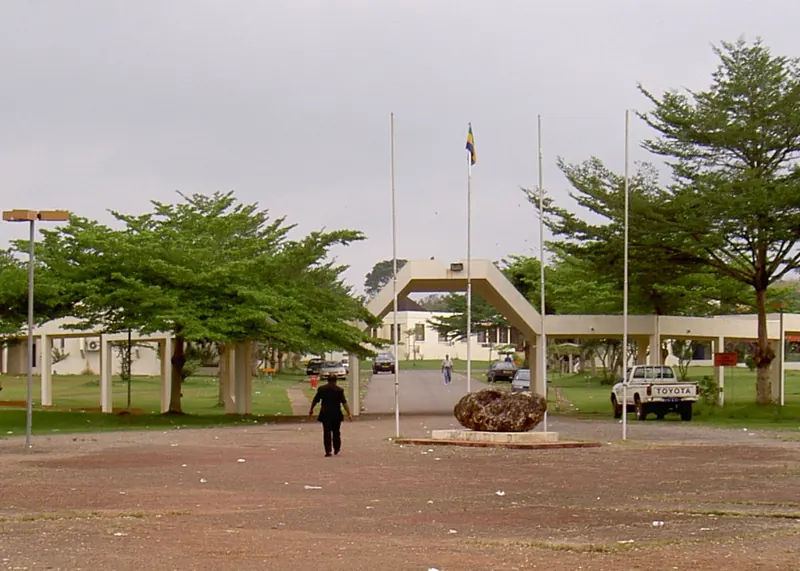
Mobile telephony, internet, infrastructure and digital services.
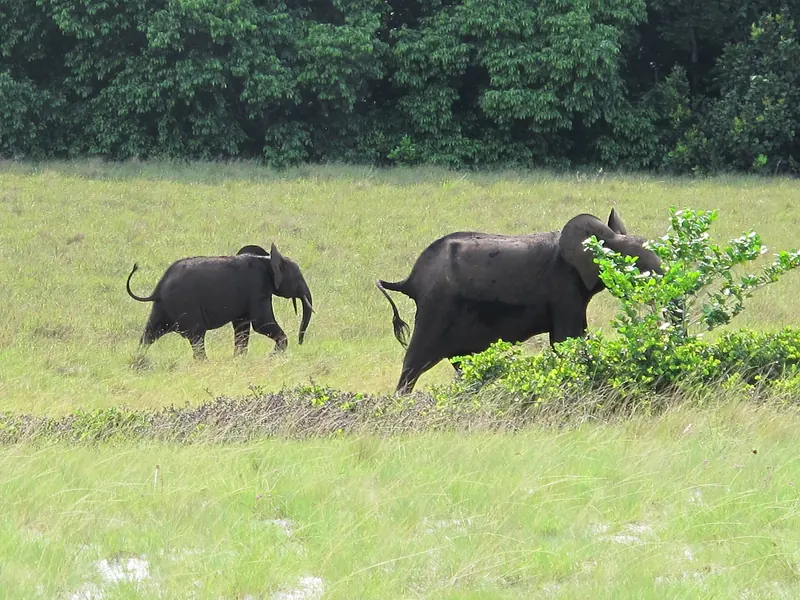
National parks, ecotourism and accommodation capacity.
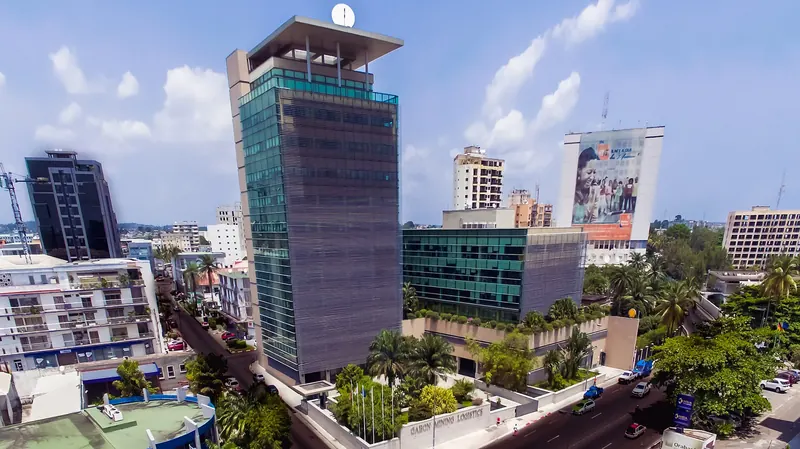
Banking, microfinance, insurance and capital markets.
Procedures
Guided path
Tell us your operation, your product and the country of origin or destination: the guided path assembles the steps, documents, authorities and fees that apply.
Formalities and documents to bring goods into Gabon.
Authorisations, certificates and export formalities.
Customs declaration, regimes and tax obligations.
Compliance, quality controls and certificates.
Approvals and prior authorisations by activity.
Customs duties, VAT and other applicable levies.
Registration, articles of association and first filings.
An indicative estimate of import duties.
Laws, decrees, orders and regional instruments.
Series and charts
In 2023, fuels accounted for 54.0% of Gabon's merchandise exports. Ores and metals accounted for 23.3% and agricultural raw materials, including timber, for 3.9%.
In 2024, 95.1% of the population had access to electricity, compared with 73.6% in 2000. In rural areas, the access rate was 51.3%.
Total and rural population, %
Access to electricity (Gabon) went from 73.6% in 2000 to 95.1% in 2024. Access to electricity, rural (Gabon) went from 11.6% in 2000 to 51.3% in 2024.
| Period | Access to electricity (%) | Access to electricity, rural (%) |
|---|---|---|
| 2000 | 73.6 | 11.6 |
| 2001 | 77.2 | 21.5 |
| 2002 | 77.8 | 21.0 |
| 2003 | 78.5 | 20.6 |
| 2004 | 79.2 | 20.1 |
| 2005 | 81.6 | 27.1 |
| 2006 | 80.5 | 19.2 |
| 2007 | 81.3 | 18.7 |
| 2008 | 82.0 | 18.3 |
| 2009 | 82.7 | 17.9 |
| 2010 | 89.3 | 50.0 |
| 2011 | 88.7 | 42.4 |
| 2012 | 89.3 | 32.3 |
| 2013 | 86.4 | 32.8 |
| 2014 | 87.1 | 19.8 |
| 2015 | 87.3 | 18.1 |
| 2016 | 88.1 | 18.9 |
| 2017 | 86.3 | n/a |
| 2018 | 89.6 | 21.3 |
| 2019 | 90.3 | 22.8 |
| 2020 | 91.1 | 24.7 |
| 2021 | 91.8 | 26.8 |
| 2022 | 93.5 | 29.0 |
| 2023 | 94.1 | 29.0 |
| 2024 | 95.1 | 51.3 |
n/a: not available.
Analysis
22 September 2026
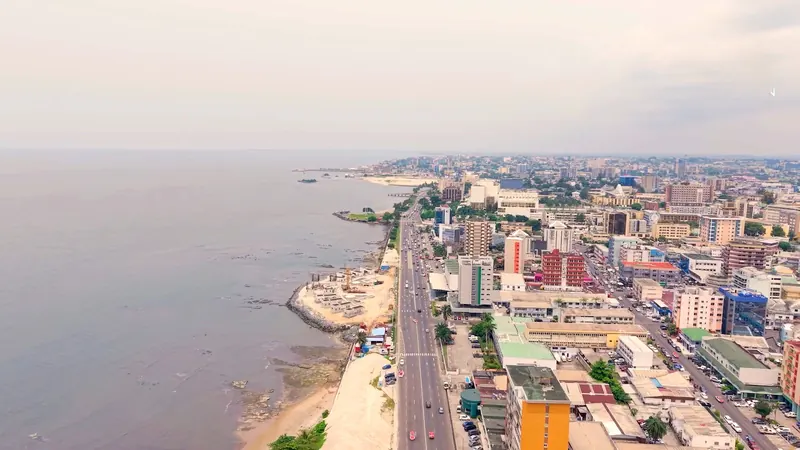
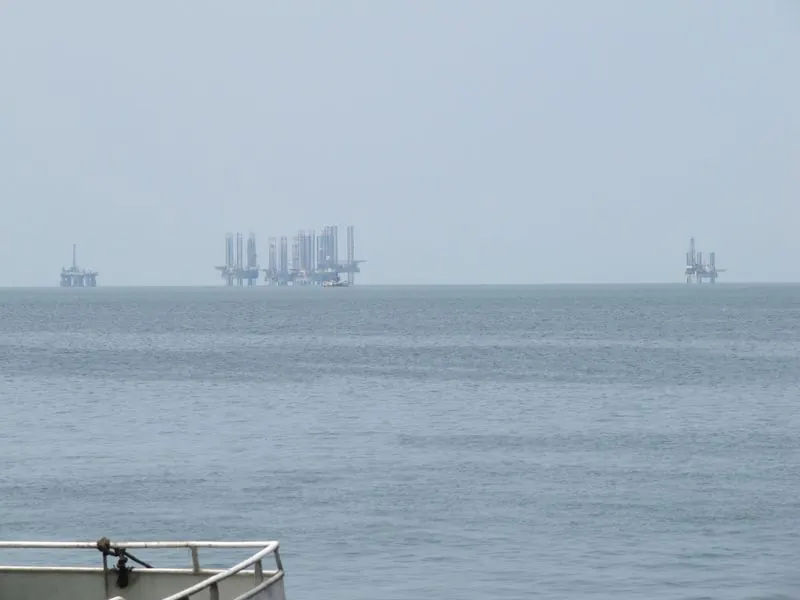
Brought down to 20% of GDP in 2008, Gabon's public debt has been above 70% again since 2023. IMF and World Bank series show how falling oil revenue and rising spending changed the trajectory, and where Gabon stands within CEMAC.
22 September 2026
From 2000 to 2025, Gabon's growth followed oil cycles. IMF, World Bank and Energy Institute data show an economy that grew slowly, whose income per person remains tied to the barrel and whose exports are only beginning to diversify.
22 September 2026
More than 125 mobile subscriptions per 100 people, nearly seven in ten Gabonese online, fixed broadband still rare but rising fast: World Bank and regulator data portray a largely connected country where the last gains are the hardest.
News and publications
Press release
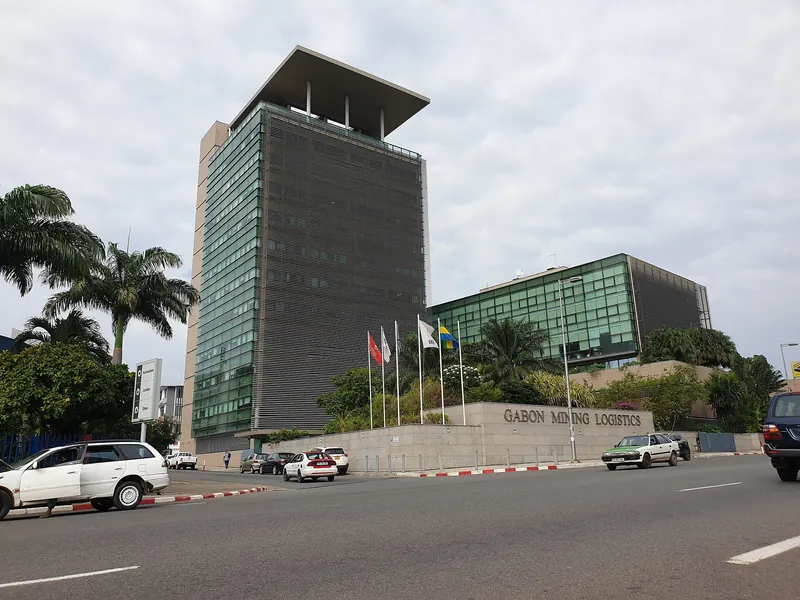
On 17 September 2026, the National Investment Promotion Agency and the National Centre for Scientific and Technological Research signed a memorandum of understanding creating a joint technical secretariat.
Press release
According to Gabonreview, the Indian groups Oil India and Indian Oil Corporation are withdrawing from the Shakthi-II oil block after failing to meet their drilling commitments, and must pay a total penalty of about 10 million dollars, or 5.6 billion CFA francs.
Programme
Meeting on 18 September 2026 in Port-Gentil, the Council of Ministers authorised the signing of a 129.7 million euro financing agreement, about 85.078 billion CFA francs, with the World Bank for the PASBAP project, according to Gabonreview.
Press release
According to Gabonmediatime, the Council of Ministers, meeting in Port-Gentil on 18 September 2026 under the chairmanship of Brice Clotaire Oligui Nguema, adopted the 2027 draft finance bill, balanced in revenue and expenditure at 6,223.1 billion CFA francs.
Press release
On 14 September 2026, Gabon Fiber SA and the Société de patrimoine des infrastructures numériques (SPIN, the digital infrastructure asset-holding company) signed a 41 billion CFA franc public-private partnership contract, about 72 million US dollars, to lease and extend the national fibre optic network.
Press release
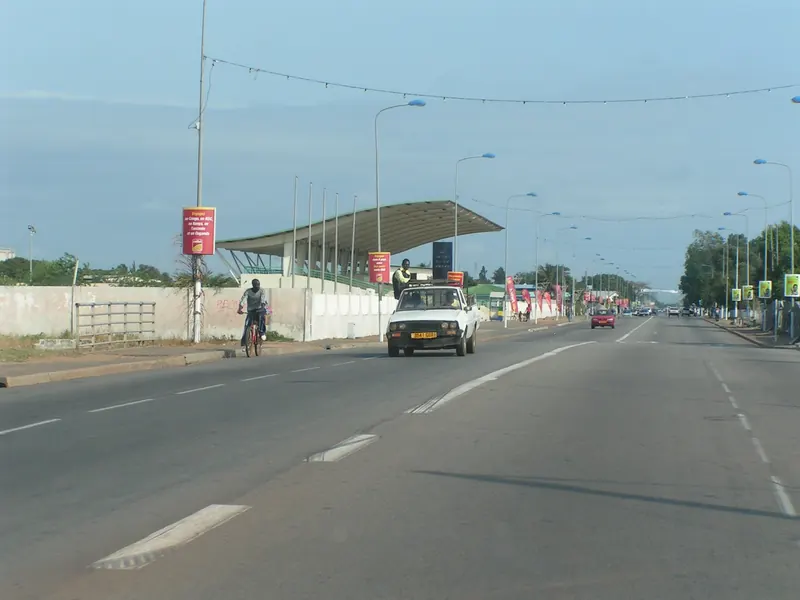
According to Gabonreview, a new scrap steel processing plant, Les Acieries du Gabon, was inaugurated in Port-Gentil on 17 September 2026, with an announced investment of 6 billion CFA francs and 500 announced jobs.
Location, the CEMAC regional market, a currency pegged to the euro, natural resources and the Nkok economic zone: Gabon's assets, presented with their sources.
Source: IMF, WEO April 2026 (NGDPD) (opens in a new tab), 2025 (estimate)
Source: World Bank, WDI (AG.LND.FRST.ZS) (opens in a new tab), 2023
Answers are provided for information only and do not replace the opinion of the competent administration.
Powered by